SLI — Service Level Indicators
This page describes the Service Level Indicators (SLI) we use for client projects, how we measure them, and where the boundaries of those measurements lie. We publish this information so you can understand not just the target values, but also the methodology, limitations, and how to interpret the metrics.
This page is informational in nature. The SLI and SLO values listed here are typical benchmarks for managed projects and do not replace the specific terms outlined in your contract, SOW, or SLA.
How to read this page
Why SLI matter for your business
SLI, SLO, SLA — how they're connected
What we measure.
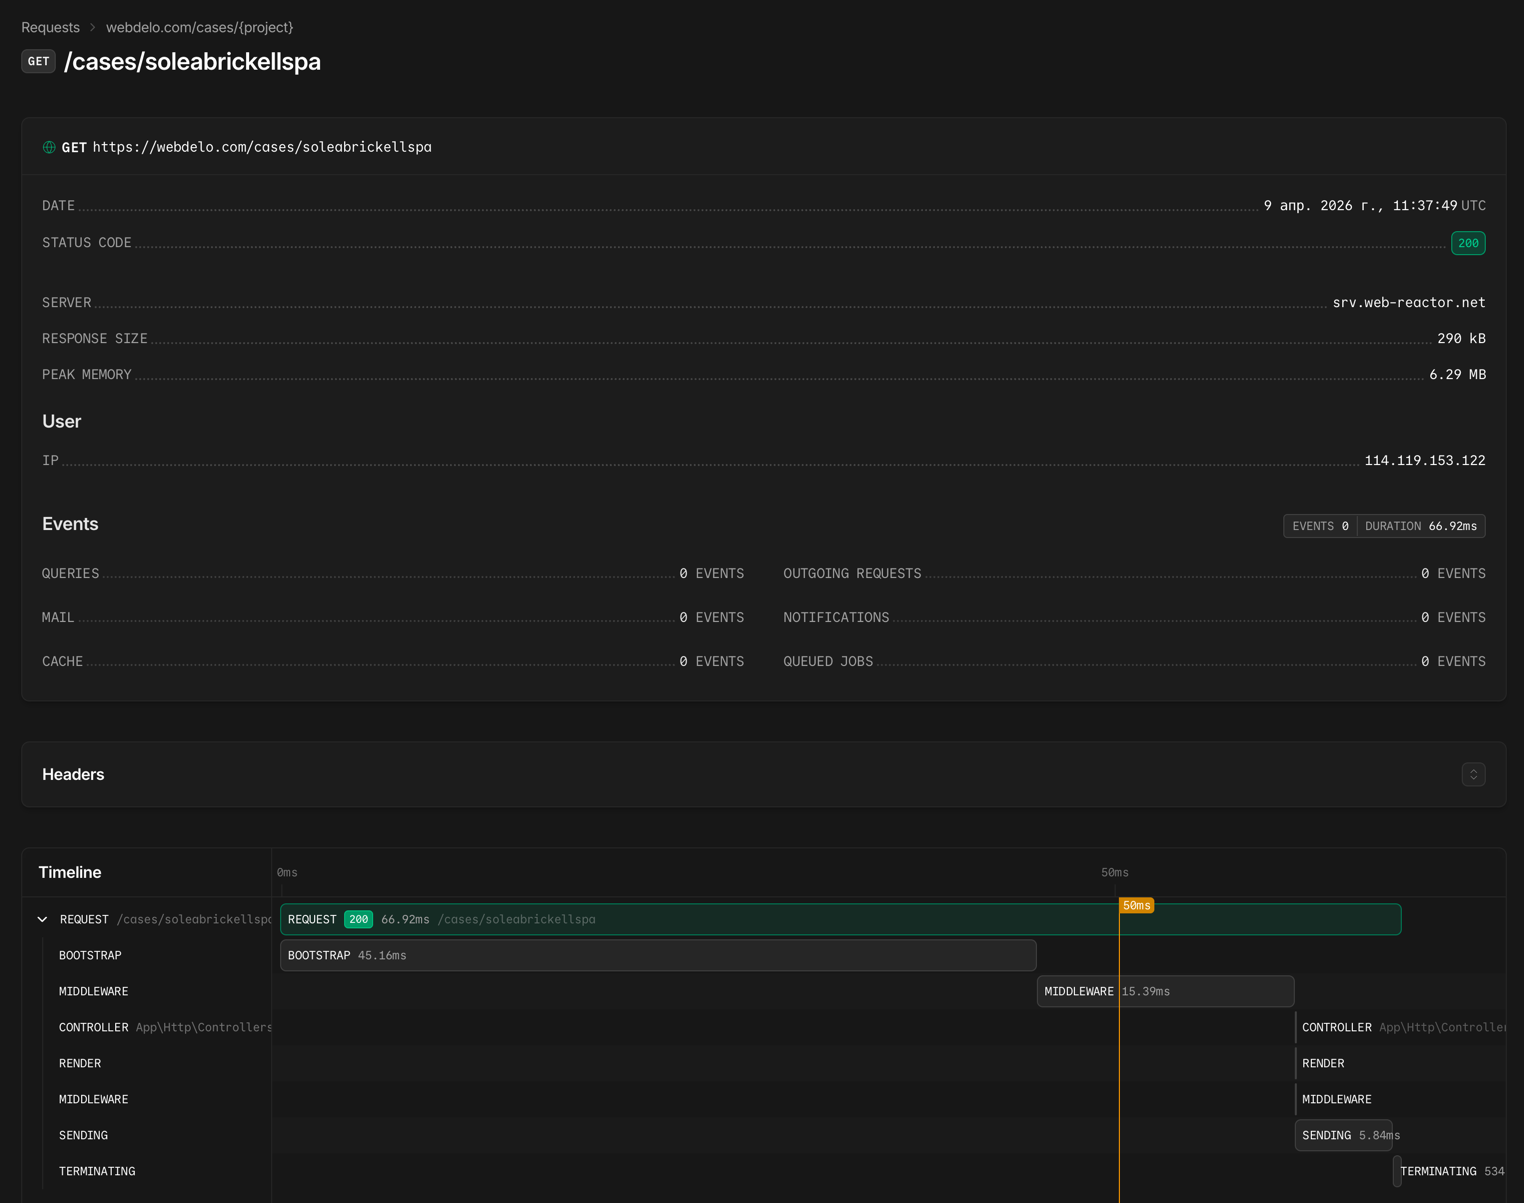
Numeric metrics that reflect the actual user experience: availability, response times, error rates, Core Web Vitals. SLI are facts captured by monitoring tools — not subjective assessments.What we aim for.
Internal targets for each SLI. For example: "API response time — no more than 300 ms for 95% of requests." SLO set the quality bar that we monitor daily and review quarterly.What we guarantee.
Formal commitments spelled out in the contract. If SLO is our internal standard, then SLA is the promise we make to you — with accountability when it's not met. Learn more about our SLACore principle: SLI feed into SLO, SLO shape the SLA. Without reliable indicators, any guarantees are just empty words. That's why we start with the measurements.
What we measure
Core indicators
| Indicator | What it shows | How we measure | Benchmark (SLO) |
|---|---|---|---|
| Uptime (Availability) | Percentage of time the service is reachable and responding correctly | Share of successful HTTP responses (2xx/3xx) out of total synthetic checks | ≥ 99.5% (standard), ≥ 99.8% (target) |
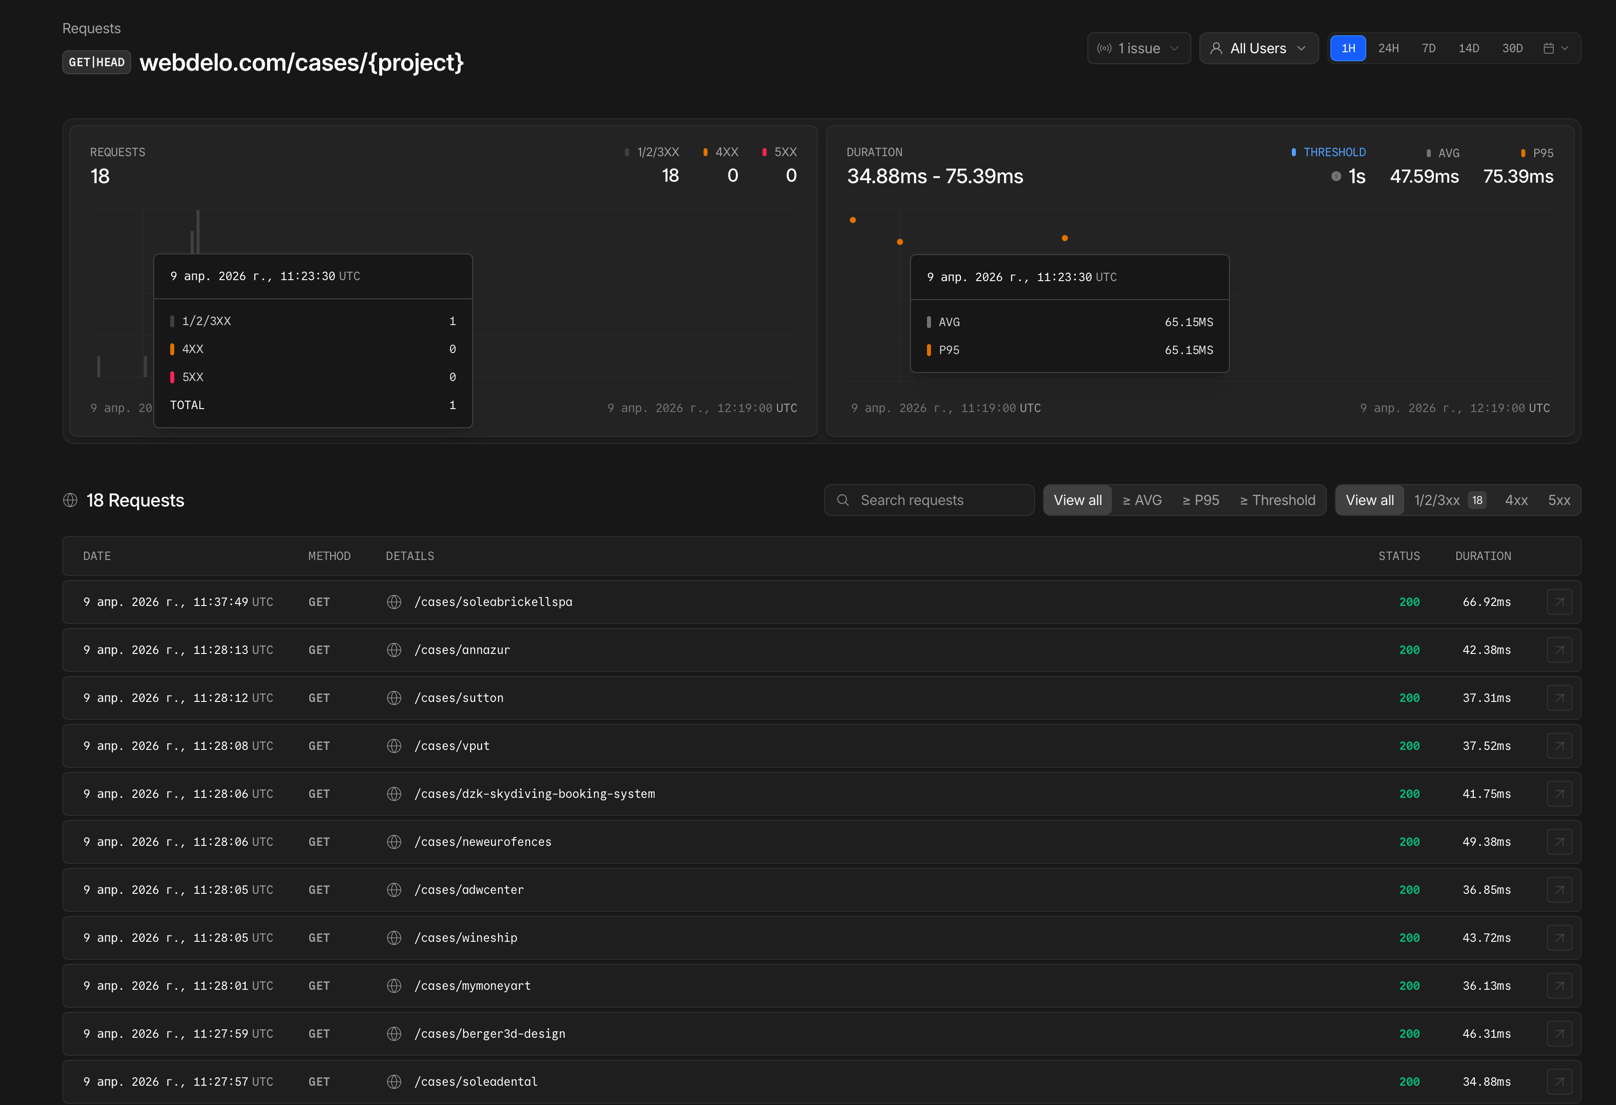
| Latency (Response Time) | How fast the server responds to a user request | Percentiles P50, P95, P99 across all requests for the period | P95 < 300 ms (API), P95 < 2 s (page) |
| Error Rate | Percentage of requests that result in a server error | Percentage of 5xx responses out of total requests | < 0.1% |
| First Response Time | How quickly the team responds to an incoming ticket | Time from ticket creation to the first substantive reply | ≤ 20 min (S1, business hours) |
Core Web Vitals
| Metric | What it measures | "Good" threshold | Our tool |
|---|---|---|---|
| LCP (Largest Contentful Paint) | How fast the main content of a page loads | ≤ 2.5 s | Lighthouse CI |
| INP (Interaction to Next Paint) | How responsive the page is to user interactions | ≤ 200 ms | Lighthouse CI |
| CLS (Cumulative Layout Shift) | Visual stability — no unexpected layout jumps | ≤ 0.1 | Lighthouse CI |
Additional indicators
| Indicator | What it shows | Benchmark (SLO) |
|---|---|---|
| TTMR (Time to Mitigation/Restore) | Time from the start of an incident to service restoration | ≤ 4 hrs (S1), ≤ 8 hrs (S2) |
| Deployment Success Rate | Percentage of deployments that don't cause service degradation | ≥ 99% |
| Saturation | Server resource utilization: CPU, RAM, disk | CPU idle > 10%, RAM < 85%, disk > 10% free |
| SSL/Domain Expiry | Monitoring certificate and domain expiration dates | Alert ≥ 30 days before expiry |
The values in the tables above serve as baseline benchmarks. For a specific project, they're refined after onboarding based on architecture analysis, load profile, and business criticality.
How we measure: tools and methodology
UptimeRobot — external availability monitoring
Synthetic checks from multiple geographic locations every 1–5 minutes:
- HTTP/HTTPS, Ping, port checks, DNS and SSL monitoring
- Instant notifications on downtime via email, Slack, Telegram
- Historical uptime data for reporting
- Public status pages for transparency with end users
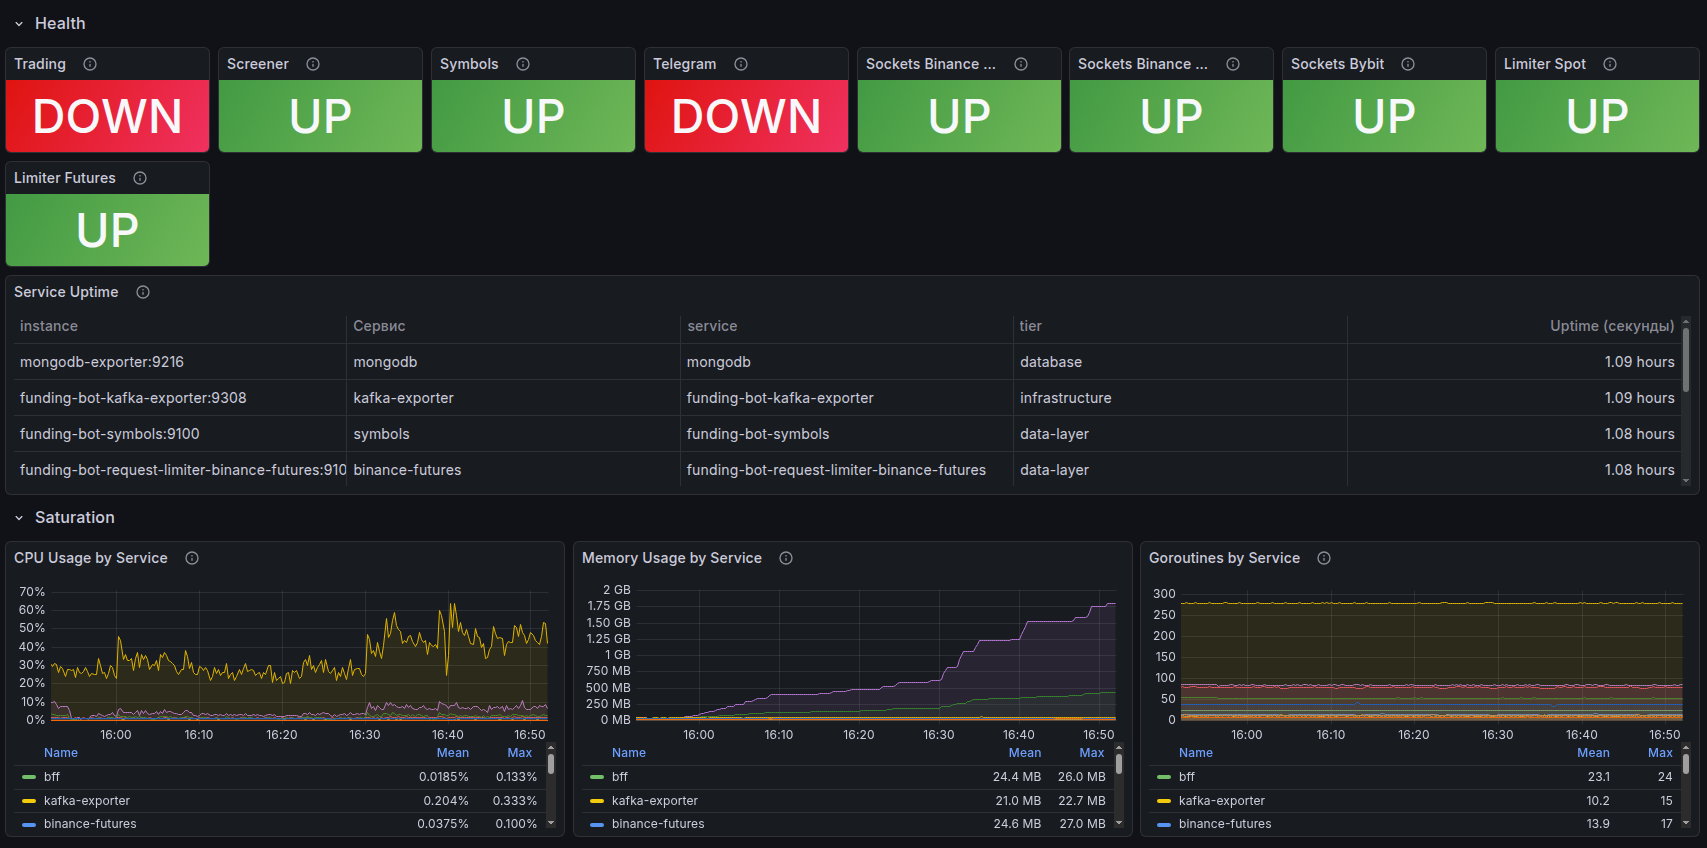
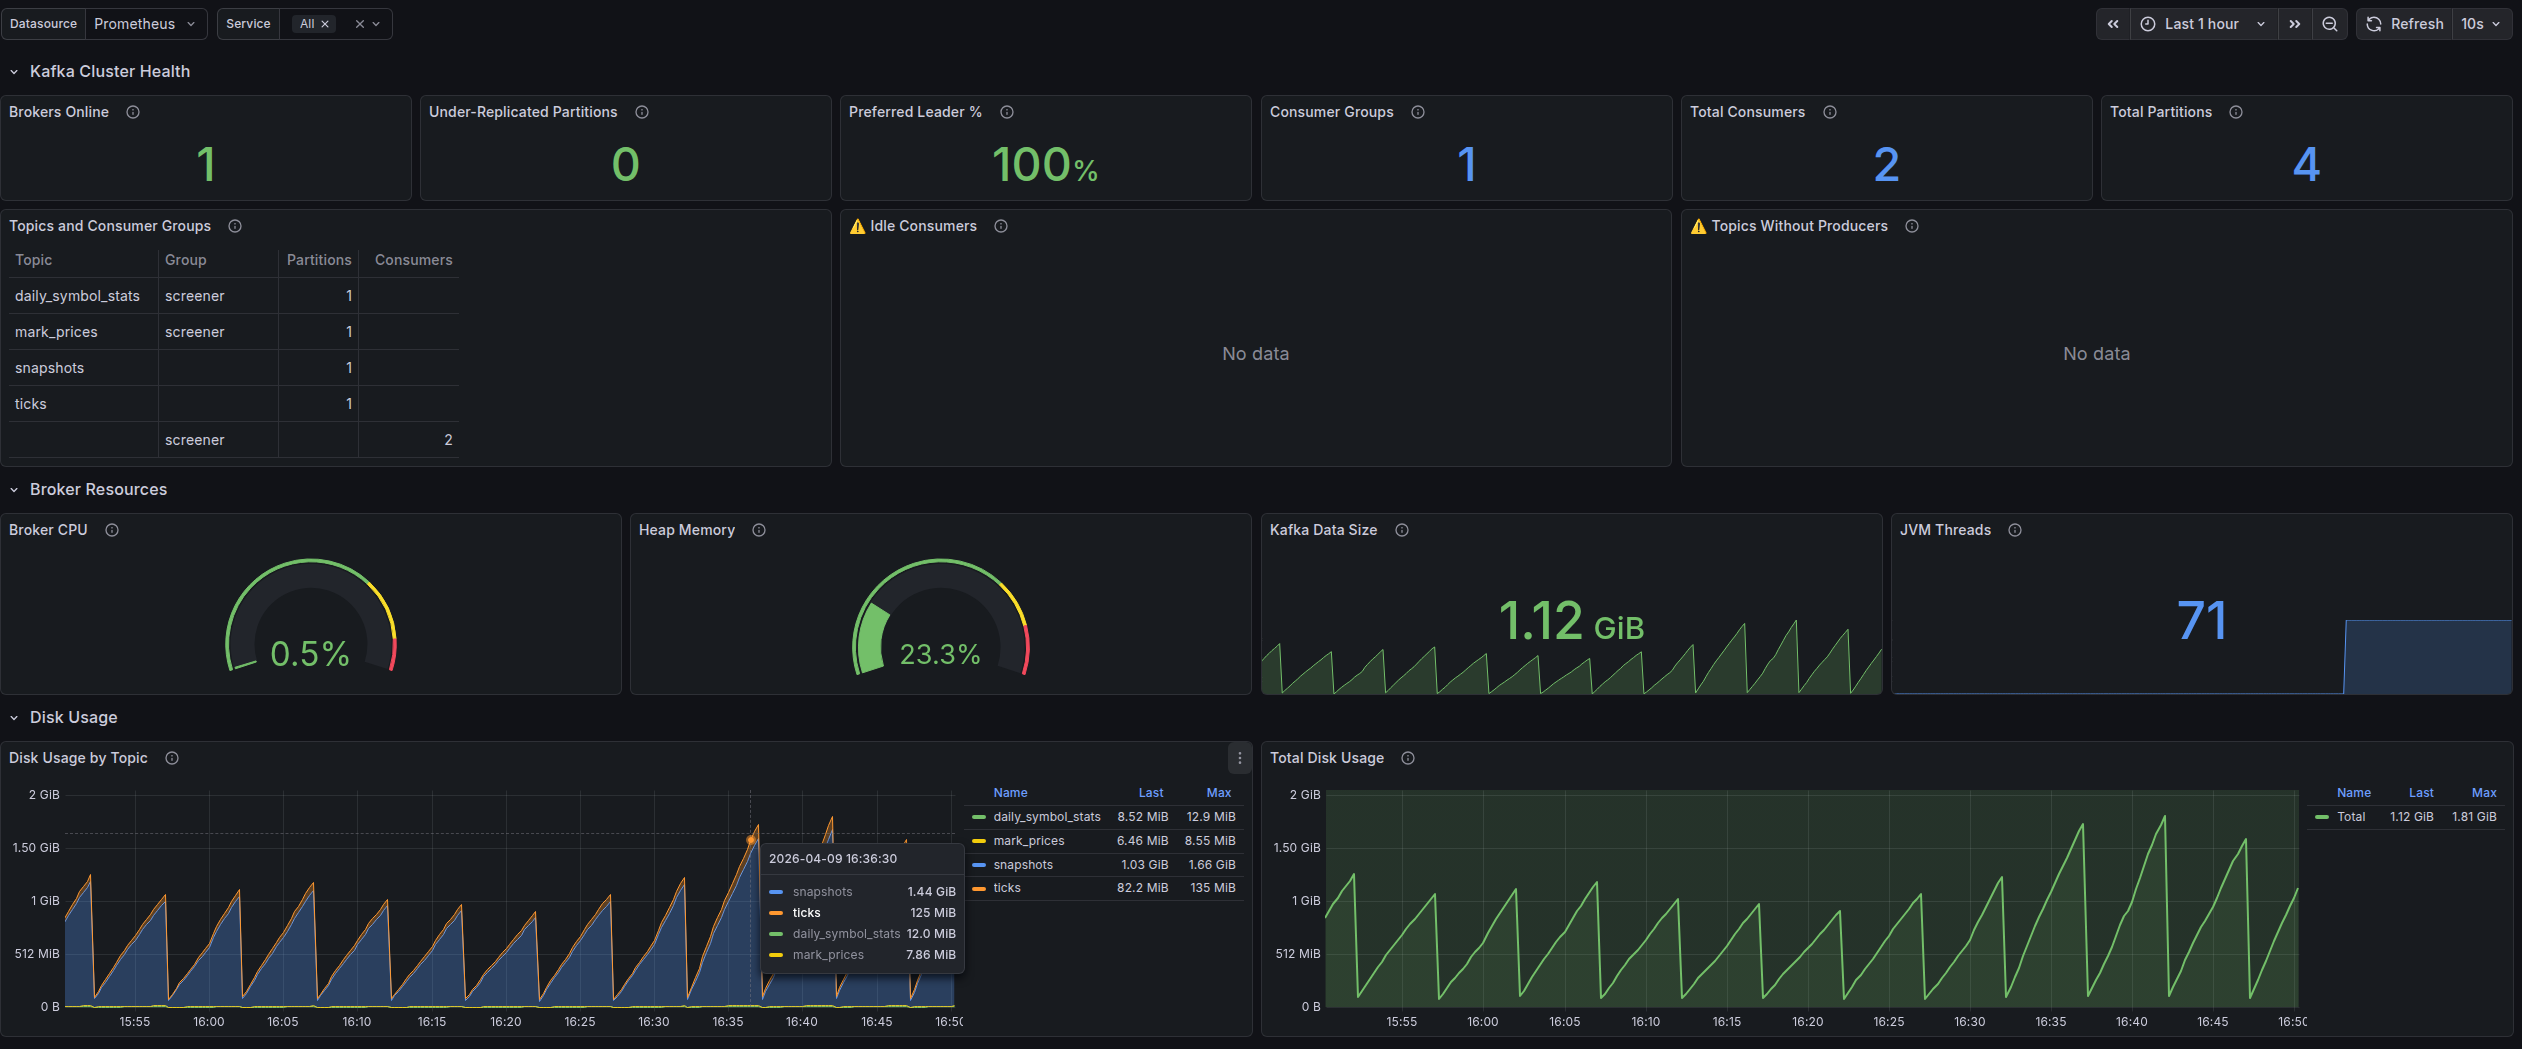
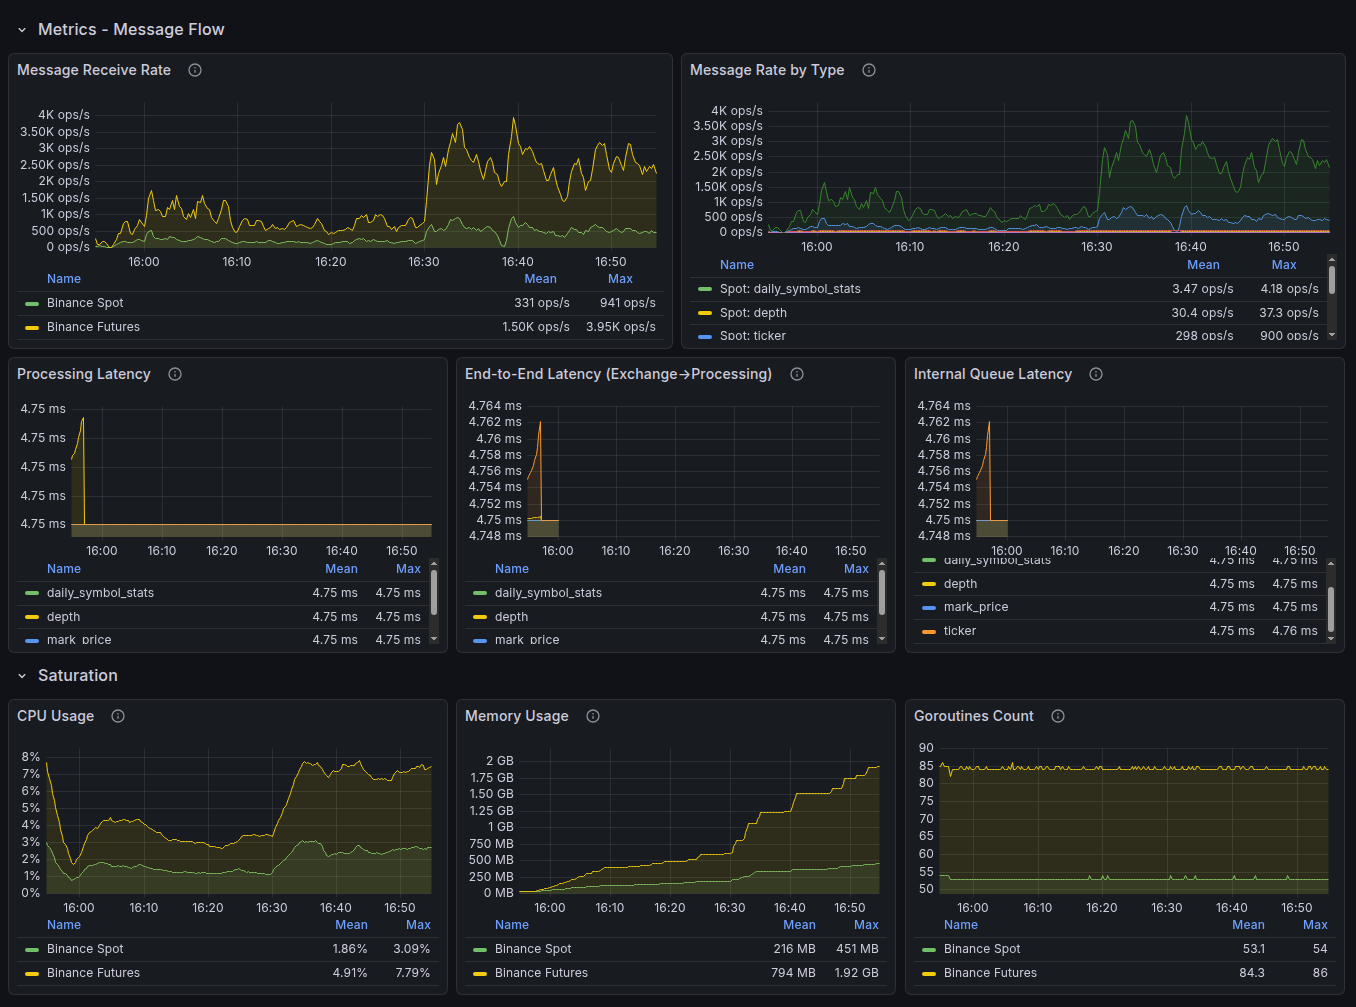
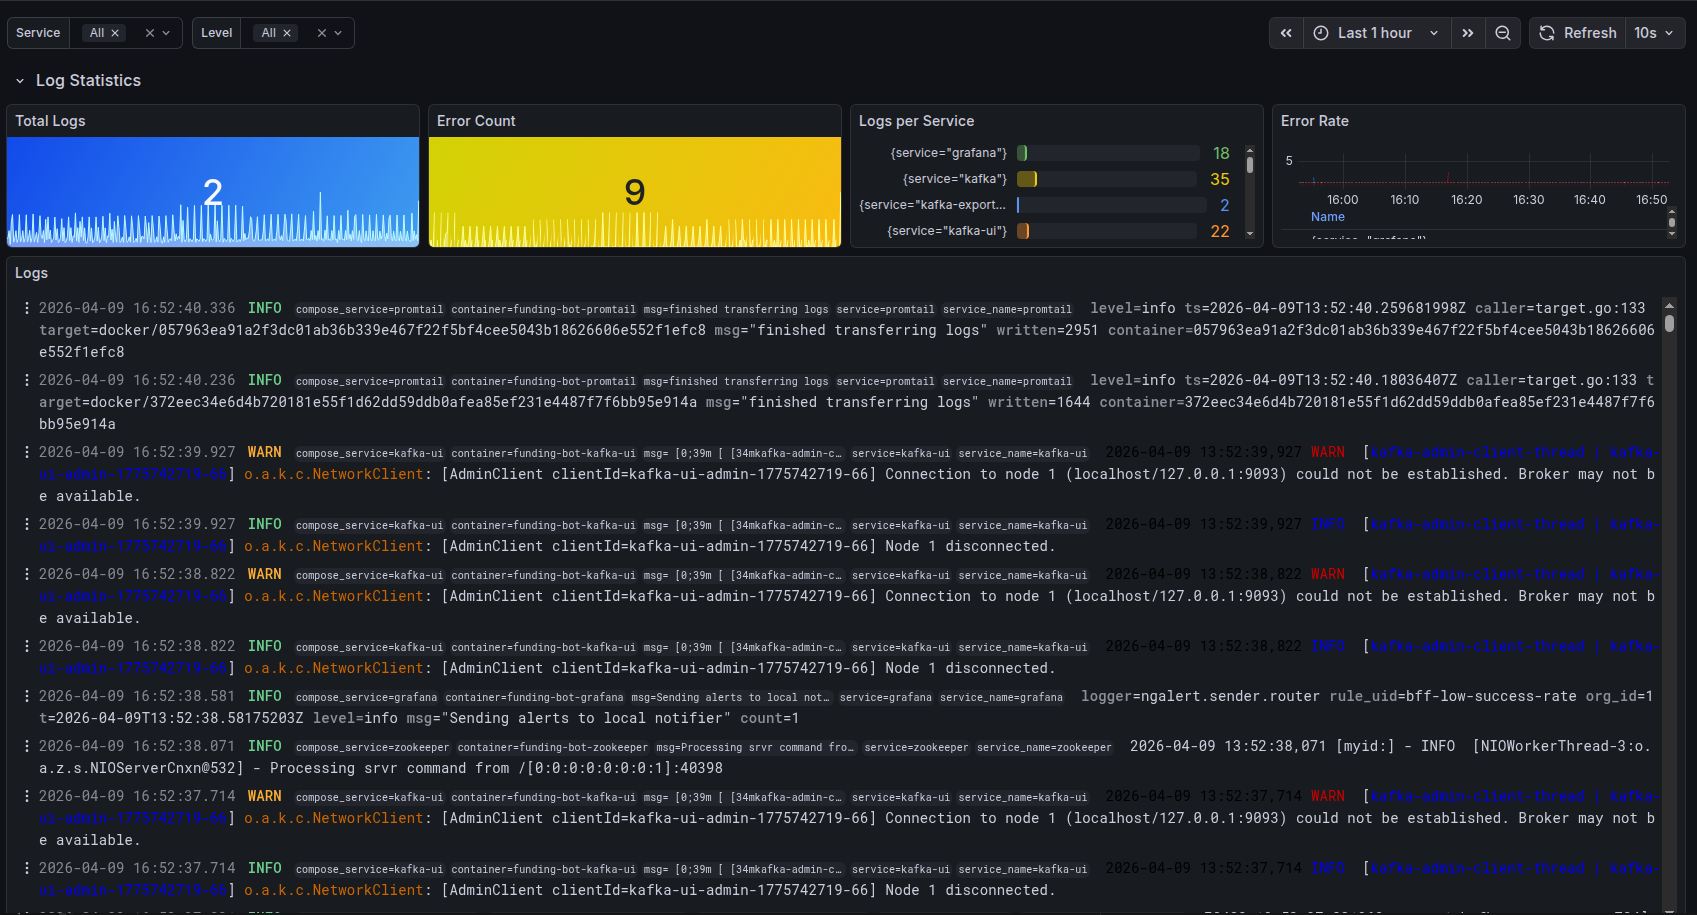
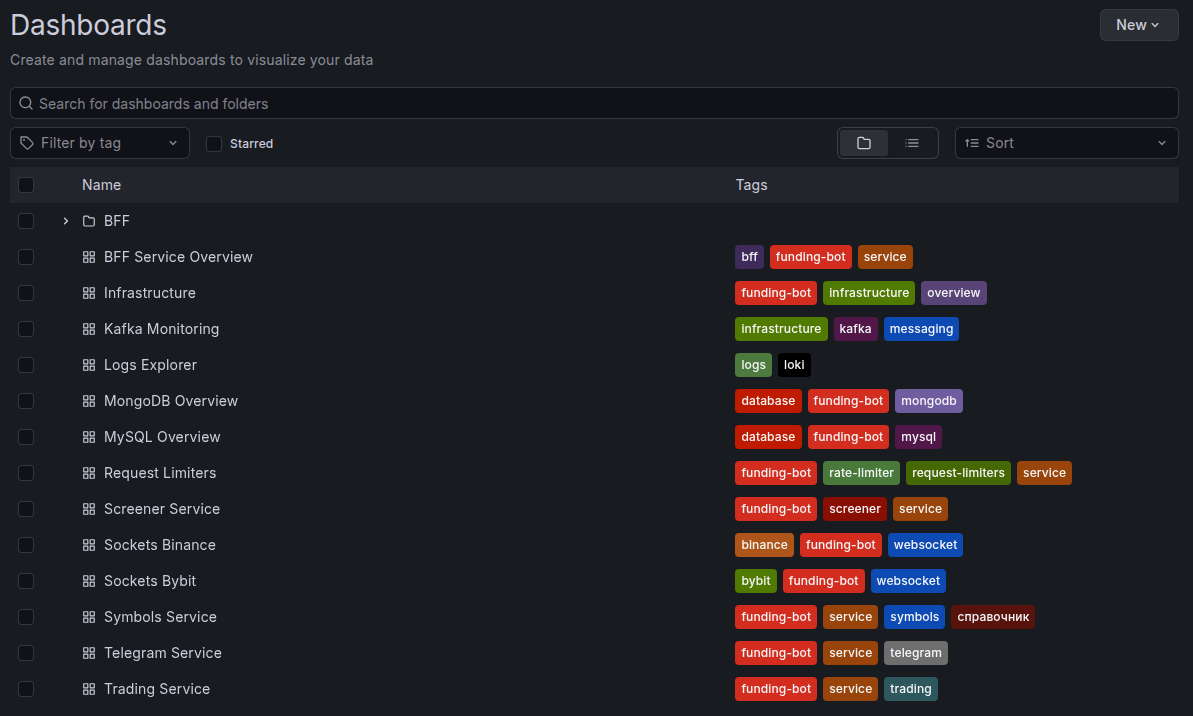
Grafana + Prometheus — visualization and analytics
Prometheus collects metrics from servers and applications, Grafana visualizes them on customizable dashboards:
- Latency (P50, P95, P99), error rate, throughput — in real time
- Server resource monitoring: CPU, RAM, disk, network
- Configurable alerts when thresholds are exceeded
- Historical trends to catch degradation before it becomes an incident
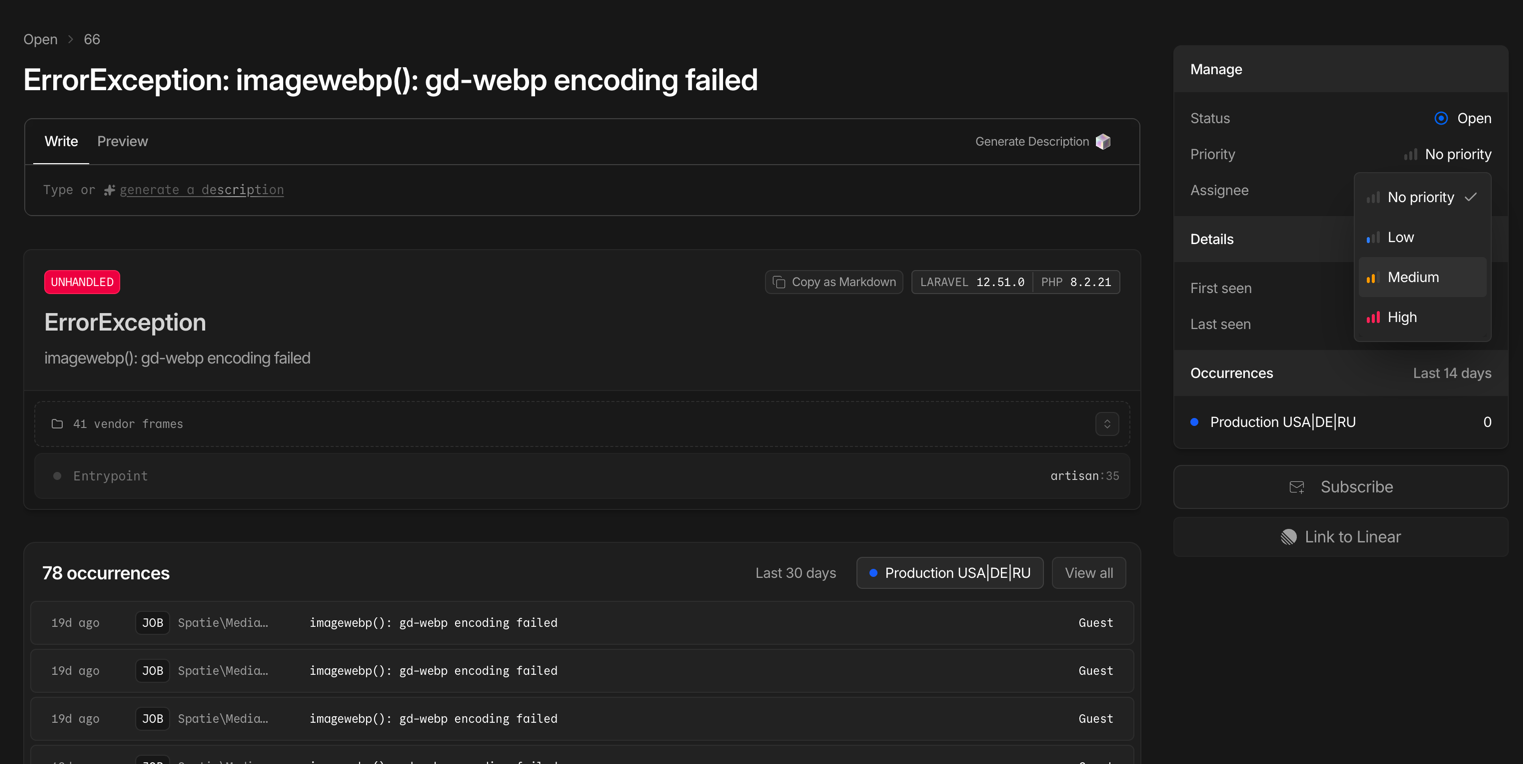
Laravel Nightwatch — application-level monitoring
Deep instrumentation for Laravel applications, built by the framework's creators:
- Tracing every request from entry to response
- Detection of slow SQL queries and queue bottlenecks
- Real-time exception and error monitoring
- Tracking background jobs and cron schedules
Note: On some projects, New Relic APM is used as an alternative to Nightwatch — a full-featured performance monitoring platform. The choice of tool depends on the project's architecture and client requirements.
Lighthouse CI — Core Web Vitals monitoring
Automated performance audits with every deployment:
- Runs in the Bitbucket Pipelines CI/CD pipeline
- Compares metrics against the previous release — regressions are caught immediately
- LCP, INP, CLS, plus accessibility and SEO audits
- Blocks deployment on critical performance drops
Methodology
Error Budget — your budget for acceptable errors
| Target Uptime | Allowable downtime per month | Allowable downtime per year |
|---|---|---|
| 99.5% | ~3 hrs 39 min | ~43 hrs 48 min |
| 99.8% | ~1 hr 27 min | ~17 hrs 31 min |
| 99.9% | ~43 min | ~8 hrs 46 min |
| 99.95% | ~22 min | ~4 hrs 23 min |
Why this matters to you: The Error Budget helps us make decisions based on data, not emotions ("let's not touch anything"). This means your project moves forward as fast as possible at your chosen level of reliability.
Monitoring levels by support plan
| Capability | Basic | Extended | Enterprise |
|---|---|---|---|
| Synthetic availability checks (Uptime) | ✓ | ✓ | ✓ |
| SSL certificate and domain monitoring | ✓ | ✓ | ✓ |
| Downtime notifications | ✓ | ✓ | ✓ |
| Lighthouse CI (Core Web Vitals) | ✓ | ✓ | ✓ |
| Latency monitoring (P50, P95, P99) | — | ✓ | ✓ |
| Error rate monitoring | — | ✓ | ✓ |
| Resource monitoring (CPU, RAM, disk) | — | Selective | ✓ |
| Application-level APM (Nightwatch / New Relic) | — | Selective | ✓ |
| Custom Grafana dashboards | — | — | ✓ |
| Proactive degradation alerts | — | ✓ | ✓ |
| Error Budget tracking | — | — | ✓ |
| SLI reporting | On request | Monthly | Weekly + QBR |
| Target Uptime (SLO) | 99.5% | 99.5–99.8% | up to 99.9%* |
Incident severity model
| Level | Description | First Response (SLO) | Resolution (SLO) |
|---|---|---|---|
| S1 — Critical | Full or partial outage, a core business process is blocked, security incident | ≤ 20 min (business hours) | ≤ 4 hours |
| S2 — High Impact | Significant degradation with workarounds available, impact on SEO or conversion | ≤ 1 hour | ≤ 8 hours |
| S3 — Medium Impact | Defects with limited business impact | ≤ 4 hours | Within the sprint |
| S4 — Low Impact | Cosmetic issues, UX improvements | ≤ 1 business day | Prioritized in the backlog |
Transparency and reporting
What's included in an SLI report
| Section | Contents |
|---|---|
| Uptime for the period | Actual availability percentage compared to the target SLO |
| Latency trends | Response time dynamics (P50, P95) with anomalies highlighted |
| Error rate | Error percentage broken down by type and source |
| Core Web Vitals | LCP, INP, CLS trends and their impact on SEO rankings |
| Incidents for the period | Count, severity, response time, and time to resolution |
| Error Budget | How much budget has been used and how much remains |
| Recommendations | Specific steps to improve the numbers |
Reporting frequency
| Plan | SLI report | Format |
|---|---|---|
| Basic | On request | Summary in the ticketing system |
| Extended | Monthly | PDF + commentary |
| Enterprise | Weekly + quarterly QBR | Dashboard + PDF + call |
Our approach to reliability
Scope of responsibility and exclusions
Our responsibility
Client responsibility
What SLI typically don't cover
The specific scope of responsibility and list of exclusions are defined in the contract and may vary depending on the project architecture and chosen support plan.
